CRM
for preventive exposure management
UX CASE STUDY
The company is aiming at providing consultancy services & software solutions in the industry of risk & exposure management within the company’s internal business processes (Business Continuity Management & Planning) as well as outsourced activities (Supply Chain Risk Management). Hence, the overarching goal is to provide knowledge, processes, and tools via which the company will be able to deal with exposure and risks in an organized way.
Introduction


Process
UX 6 STAGES
User Experience design process is a part of creating a Proof-of-Concept version of a product, represents an iterative procedure that helps to continuously improve and polish designs. During the process, you repeatedly go through different stages, evaluating your design on each stage. Every stage of the process requires responsible stakeholders’ participation to make the products highly efficient and usable. Overall there are six stages.
IntroductionSTRATEGY
RESEARCH
- Stakeholders Interviews
- Feature List Audit
- Heuristic Review
- SWOT Analysis
- User Interviews
- Surveys
ANALYSIS
- Flow Chart
- Personas
- Customer Journey Map
DESIGN
- Sketches & Wireframes
- Prototypes
- Style Guide
PRODUCTION
- Development
- Technical Testing
LAUNCH
research
Stakeholders Interviews
Interviewing stakeholders was an important stage for building the business model canvas.
The interviews gave us project insights along with the stakeholders’ concerns as well as the advantages and value the product is going to offer to its users.
One of the key points is to identify problem areas of the current solution. As a result, we got a complete list of roles and their tasks.
BUSINESS ANALYSIS
Sales & Marketing/Application specialists
Users (Account Managers, Marketing Specialists, Application Specialists) that create product exposure requests, compare product risk profiles and print exposure reports to use them during discussions with customers.

Subject Matter Experts (SMEs)
SMEs perform the software’s primary functions, e.g. exposure assessment of all items loaded into the software for printing reports for specific item groups. SMEs (or Supply Chain Managers, Procurement managers, Quality Specialists, Material Managers, etc.) can be considered daily users of the software to be developed. These users are highly educated in general and have in-depth knowledge of the items being assessed in the software. However, the software should be developed in a way that ensures simple operability resulting in high user acceptance.

Risk Manager/Exposure Manager
Each customer/company using the software needs to appoint at least one person that will coordinate and maintain the data within the software to be developed. This person can be considered an Exposure Manager, a role that combines both aspects - SME and Sales/Marketing.
Personas
Proto-personas help us set the structure and priorities for the users. We create assumptions in terms of perspectives and opportunities on the Journey Map. Based on personas, later assumptions on users will be validated via qualitative research.
ANALYSIS & CONCEPT
JOURNEY MAP
A Customer Journey Map is a visual representation of every interaction your customers have with you. It helps to tell the story of a customer’s experience of interacting with a brand starting from the primary engagement and ending with long-term relationships (hopefully). Customer journey mapping helps businesses wear the customers’ shoes and look at their business from the customer’s perspective. It helps businesses collect insights about major pain points in order to be able to improve customer’s experience as well as define what current and prospective customers need to complete a purchase.
ANALYSIS & CONCEPT
FLOW CHART
A flowchart is a visual representation of the sequence of steps and decisions needed to launch a process. Each step in the sequence is noted within a diagram shape. The steps are linked via connecting lines and directional arrows. Thus anyone can view the flowchart and follow the process logically from the beginning to the end.
ANALYSIS & CONCEPT
Design
STYLE GUIDE
When developing the style guide, the following design principle was used: the sizes in the mockups are multiples of 4 pixels, this applies to margins, fonts, elements, etc. It means that any size can be divided into 4, e.g. 4-8-12-16-20-24-28...pixels. There can be exceptions, but in the future, we are planning to fix those.
Design
VISUAL DESIGN
The client’s corporate colors were used in visual style development. The key decision during the development of interface components was to borrow styles from familiar user applications with minor improvements. Using this approach, we tried to minimize user misunderstandings when working with a new product.
Design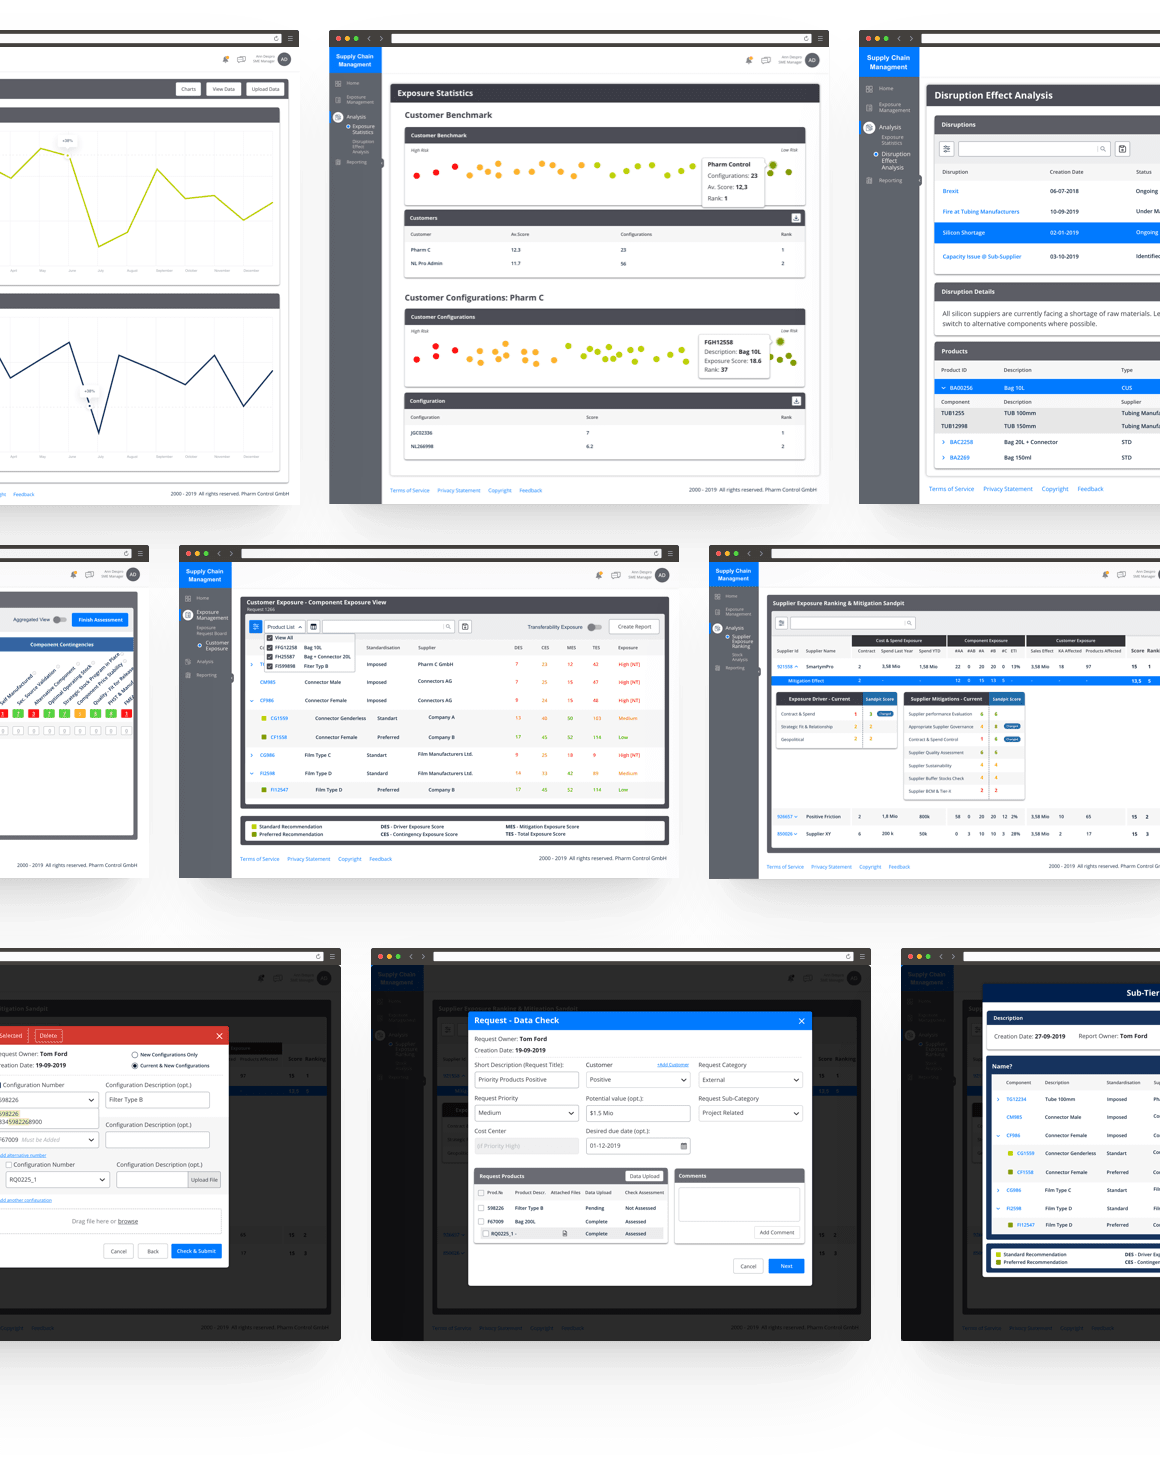
summarizing
The discovery phase lasted for a month, at the and of which we presented a full-fledged Proof-of-Concept. We created about 130 screens and conducted a full-cycle UX Study and primary Business Analysis. During our work, we were able to fully understand both business and user requirements. We managed to present a PoC of a product that will generate revenue for the company, as well as it will cause fewer user mistakes thanks to the convenient and intuitive interface. Now we are planning the next application development stages.

Time to start a new project? Or just want to say "hi"?
- Smartym ProPolandPoland, Warsaw, Aleja Armii Ludowej, nr 6
- UK7 Whitechapel Road, E1 Studios Office 406 London E1 1DU
- GermanyGermany, Frankfurt, Weissen Turm 33